Software Platform
10Sorex IIoT
Software Platform
and API Service
10sorex software platform is a comprehensive and user-friendly solution that enables efficient management and monitoring of remote water tanks. The platform offers a wide range of features, including real-time data visualization, customizable alerts and notifications, historical data analysis, and predictive analytics. It provides users with a holistic view of their industrial assets in remote areas, allowing them to make data-driven decisions for optimal water management. The platform is accessible via web browsers and mobile devices, providing convenient remote access to critical information anytime, anywhere. 10sorex's software platform is designed with a user-centric approach, offering intuitive navigation and a user-friendly interface for easy setup and configuration. With its advanced features and ease of use, 10sorex's software platform empowers users to effectively monitor and manage their water tanks in remote areas, ensuring efficient and sustainable water resource management.
Key Features
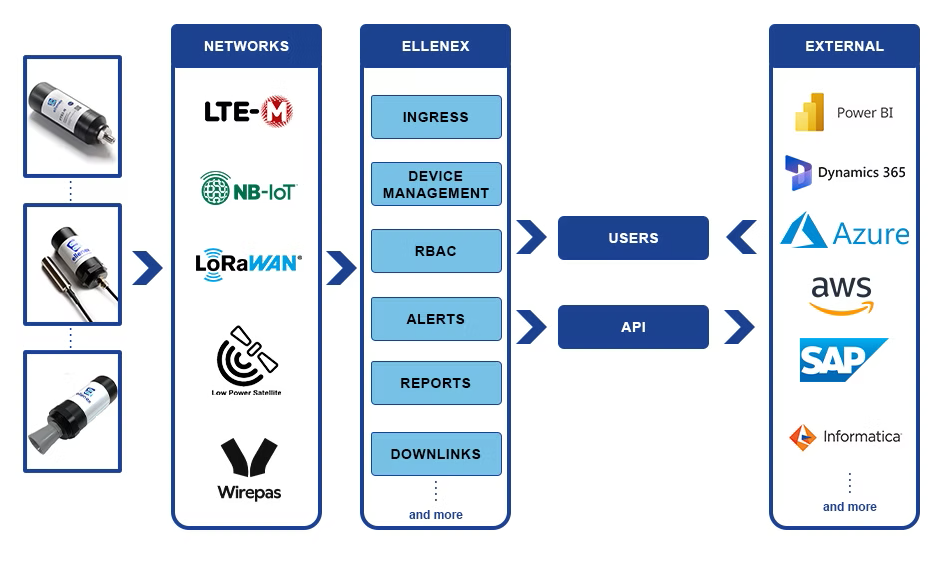
- 10sorex Platform is built on top of a fleet of microservices that scale automatically to accommodate for dynamically changing customer loads with no manual intervention.
- Our customer data is securely accessible based on our industry leading role-based access control system with granular read and write permissions.
- Get notified whenever your sensor readings go beyond a threshold or access your dashboard to see historical status.
- Send downlinks to modify the behaviour of your devices on the go.
- Run calibration and make sure your devices are reporting accurate values adjusted for deviation or mechanical wear.
- Organize large fleets of sensors into different subscriptions so different teams can access devices belonging to their specific domain.
Platform Features
Data Visualization
Aggregate data from all devices into intuitive dashboards.
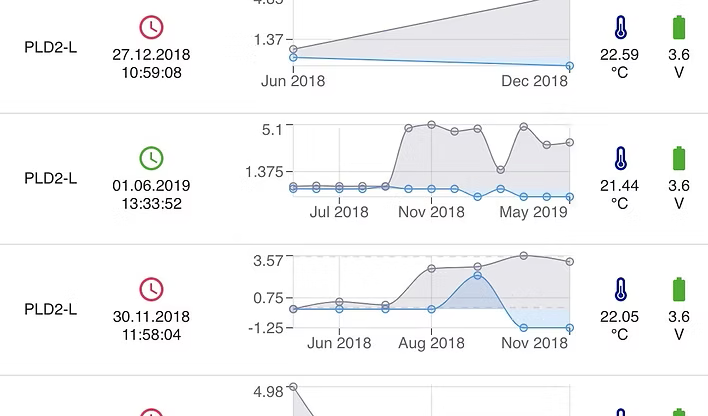
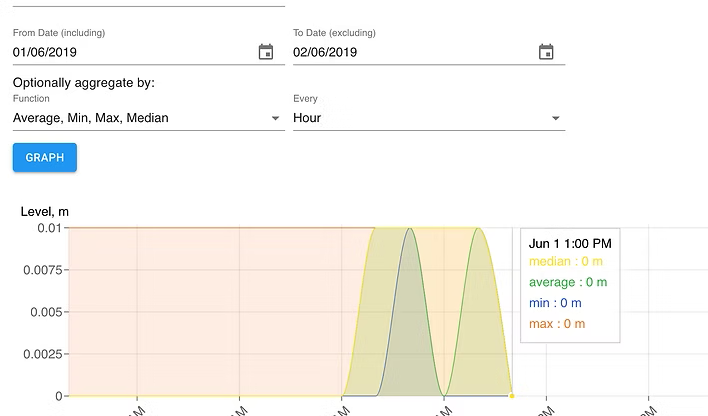
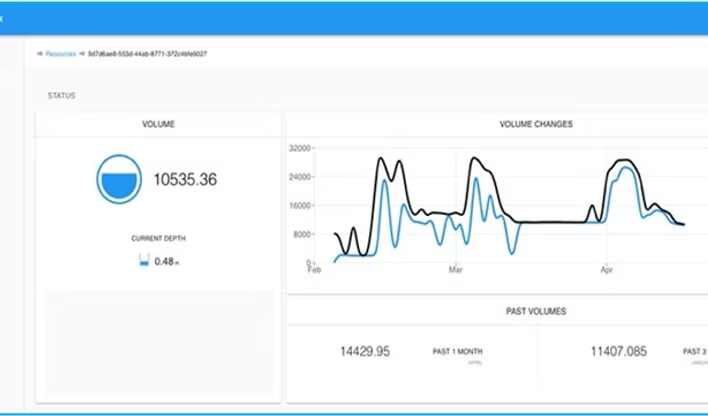
Historical Data Analysis
View trends, minimums, maximums, and aggregated readings over time.
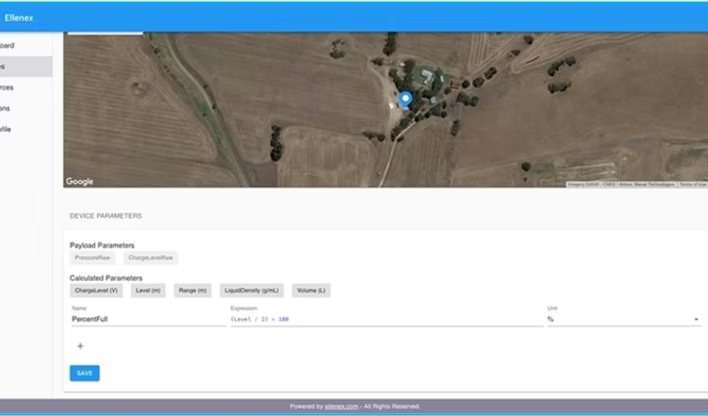
Complex Logic & Location
Apply custom formulas and track asset locations with precision.
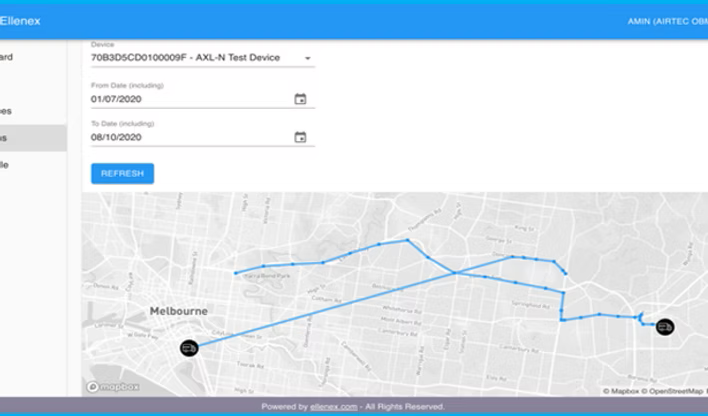
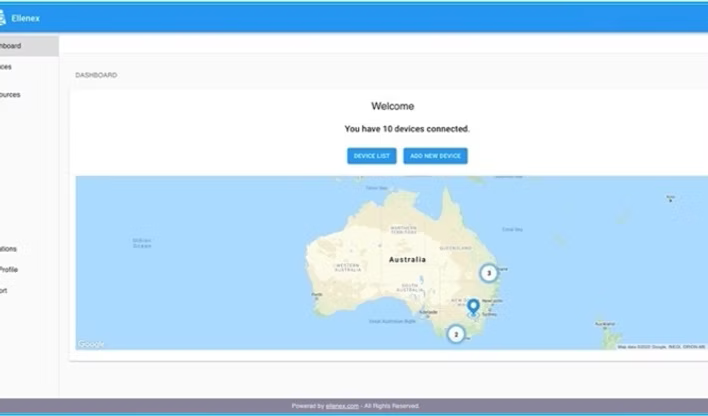
Device Map
Visualize your fleet’s geographical distribution at a glance.
Volume Prediction
Utilize predictive modeling to estimate tank volume changes.
GPS Monitoring
Monitor asset movement in real time using GPS-equipped sensors.